Even though SAP provides connectivity to both SAP BW and relational data, combining these data sets into a single report can be tricky. There are lots of ways to do it:
- A Single, Federated Query combining an SAP DSO and Relational data at the universe tier.
- A Single, Federated Query combining an SAP Infocube Relational Schema + Relational data at the universe tier.
- Two non-Federated Queries, one BW Query and one Universe query, merging the data at the report (WebI) tier.
The first method has long been supported but you loose all the value-added elements of the Infocube. Most customer I work with want to connect to the BEx Queries that run against the Infocubes.
The second method is supported, but not recommended. The semantic layer via the federation engine is able to interrogate the Infoprovider and expose it as a relational star schema. Here are a list of some of the elements you lose:
- BW Hierarchies
- Restricted and Calculated Key Figures
- BEx Queries
- BW Variables
- Currency & Unit Conversion
- Exceptions, Conditions
>> I always use the third approach, but there’s one big problem. Hierarchies have remained a huge challenge. Until Now.
SAP Hierarchies
Many customers have SAP Hierarchies that they have developed that they want to combine with non-SAP data. The problem is that when you merge the data at the report level, the roll-ups no longer work. Today I’ve discovered that there is a “secret formula” that solves this issue and I think you’ll like what you see.
Step by Step
Let me walk you through an example step-by-step.
The first thing I have to do is create an Infocube with a hierarchy and create a BEx Query on top of the InfoCube. In my case I have a characteristic called District, which contains a hierarchy called,Regional. In my example the hierarchy is a simple, two level hierarchy.
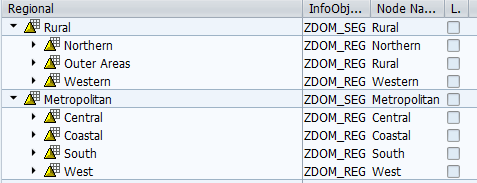
Infocube 2-level Hierarchy
I then created a BEx Query for that leverages this hierarchy.
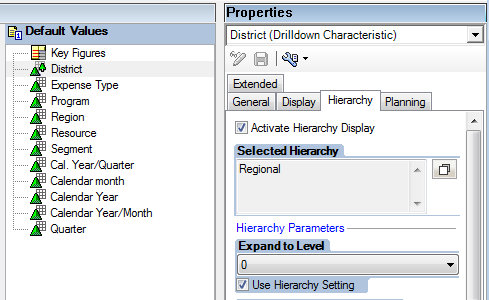
BEx Query which references a hierarchy
Next I created an OLAP connection within the CMC to the associated BEx Query.
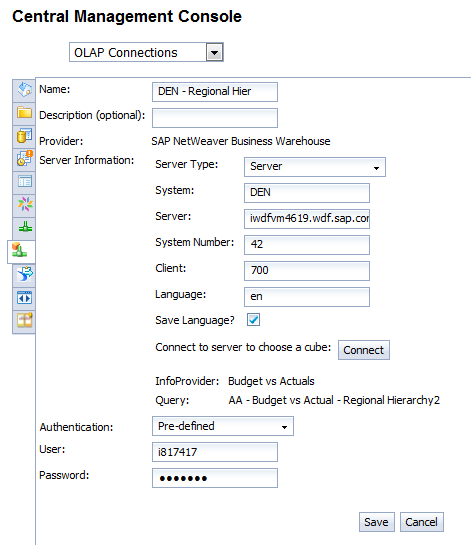
Create OLAP Connection in the CMC
Once the connection to the SAP data is complete, I created a data set in SQL Server which matches all the base level members. Here is a view of the data:
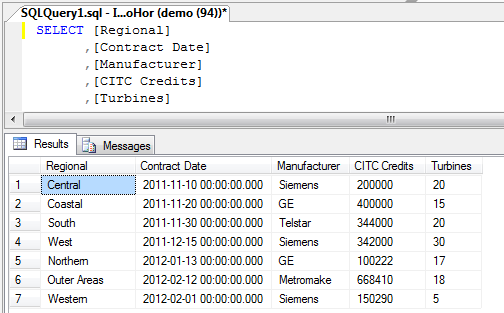
View of SQL Server data which matches my SAP data
I then created and published a universe that connects to the SQL Server data and returns the correct results.
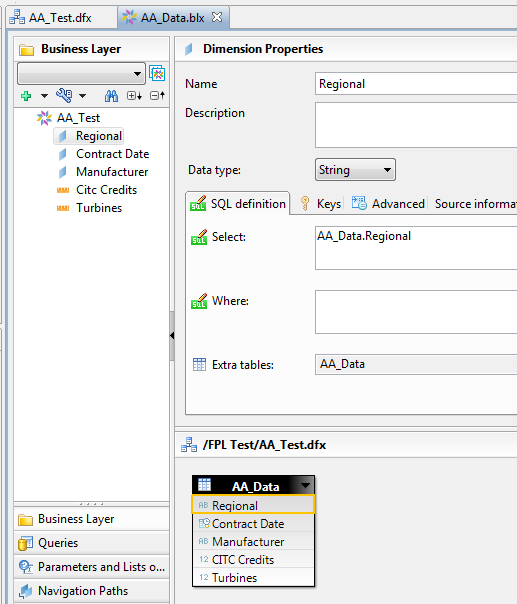
Universe Connecting to Data in SQL Server
Now it’s time to create a WebIntelligence Report. First I’m going to connect to the BEx Query and pull in Regional (Hierarchy) as well as the measures Actual Amount and Budgeted Amount.
Next, I accessed the Data Access > Data Providers > New data provider and selected Universe. This allowed me to connect to the SQL Server universe and added the elements from SQL Server and run the second query.
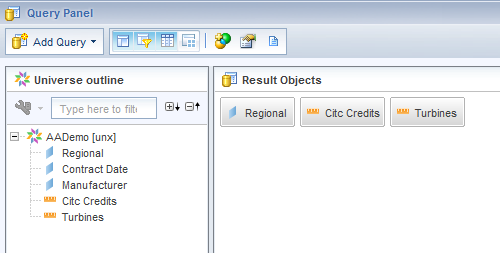
Query Panel Connecting To SQL Server (non-SAP) data
Now I had all the data I need from the two queries. One query is pulling data from BW with a hierarchy and the other query is pulling data from SQL Server. Here is what the data providers looked like once both queries have been added to the report:
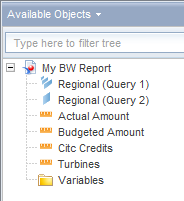
The Available Objects from Query 1 & Query 2

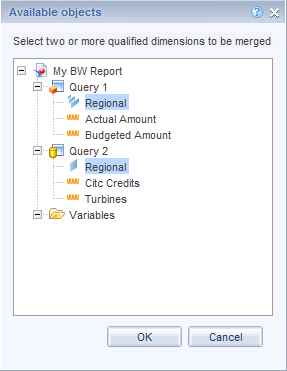
Now I simply needed to merge the two data elements Regionaltogether. All you have to do is highlight to two values and choose Data Access > Data Objects > Merge.
From here select the Regional objects.
Once that was done, the key figures from the SAP and Relational data can be combined together is the same table and this is what the results look like when put into a table. The first 3 columns come from SAP and the last two columns come from SQL Server:
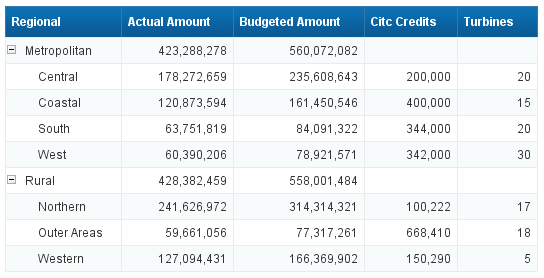
Data Is Merged But Calculations Do Not Roll Up
You see that the elements all match and appear together at the lowest level, but the parent values are not rolling up. This is because WebI is also looking for the values Metropolitan and Rural in the dataset. If I was not doing simple addition, I would have no choice but to add these into the original data in SQL Server. In my case I am doing a simple roll-up SUM(), therefore I can fix this with a new formula!
Magic Formula
Here is the magic formula:
=If( [].[].IsLeaf =1 )
Then [<relational_measure_name>]
Else Sum( [<relational_measure_name>] ; Descendants([<olap_webi_query_name>].[<olap_hierarchy_name>];1;Self_After) )
Then [<relational_measure_name>]
Else Sum( [<relational_measure_name>] ; Descendants([<olap_webi_query_name>].[<olap_hierarchy_name>];1;Self_After) )
I say “magic” because when I first saw this formula, I was blown away. Now that WebIntelligence contains a number of native OLAP functions, these types of OLAP-centric calculations are possible.
Leverage This New Formula
In my case I had two key figures which were coming from SQL Server, so these values would need to be replaced with formulas that included this new OLAP roll-up math.
I created a formula for the Citc Credits first:
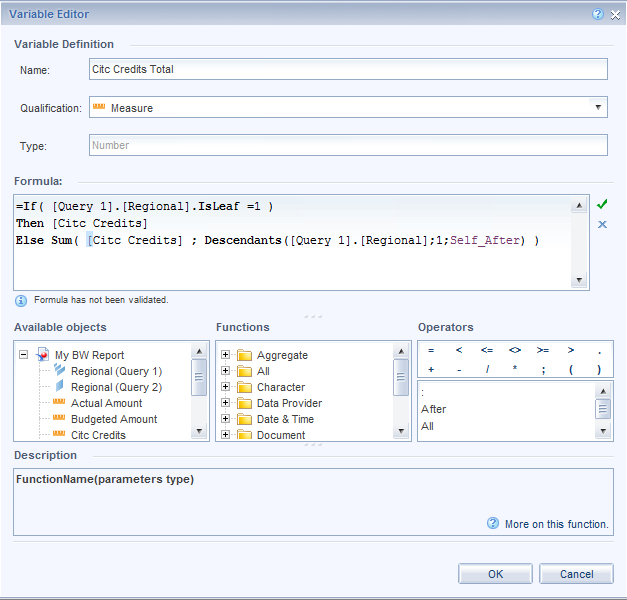
New Citc OLAP Formula
I did the same for Turbine Totals and ended up with the following Available Objects. You can see my two new Variables: Citc Credit Totals and Turbines Total.
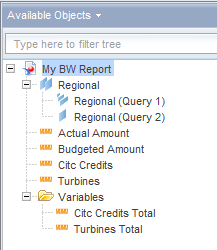
Available Objects with New Variables for OLAP Rollups
Once I replaced the SQL Server key figures with the new OLAP formulas, I was able to see the magic in action.
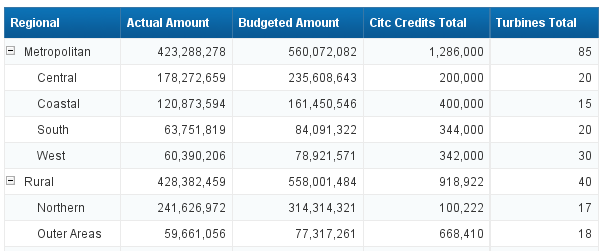
WebI Report With Correct Hierarchical Rollups
Conclusion
It’s not perfect but it works… and it works very well. Ideally it would be best if we could merge the data at the semantic layer so that for each report the user didn’t have to have to create a series of formulas to solve this problem… however until a better semantic layer solution exists that supports hierarchies like this, I’m going to be a big fan of this new workaround.


No comments:
Post a Comment